| – Highly Confidential; For Discussion Purposes Only – November 15, 2024 Discussion Materials Project Telluride |
| 1 – Highly Confidential; For Discussion Purposes Only – Disclaimer This presentation has been prepared by Centerview Partners LLC (“Centerview”) for use solely by the Special Committee of the Board of Directors of Telluride, Inc. (“Telluride” or the “Company”) in connection with its evaluation of proposed strategic alternatives for Telluride and for no other purpose. The information contained herein is based upon information supplied by or on behalf of Telluride and public ly available information, and portions of the information contained herein may be based upon statements, estimates and forecasts provided by Telluride. Centerview has relied upon the accuracy and completeness of the foregoing information, and has not assumed any responsibility for any independent verification of such information or for any independent evaluation or appraisal of any of the assets or liabiliti es (contingent or otherwise) of Telluride or any other entity, or concerning the solvency or fair value of Telluride or any other entity. With respect to financial forecasts, Centerview has assumed that such forecasts have been reasonably prepared on bases reflecting the best currently av ailable estimates and judgments of the management of Telluride as to the future financial performance of Telluride, and at your direction Cente rview has relied upon such forecasts, as provided by Telluride’s management, with respect to Telluride. Centerview assumes no responsibility for and expresses no view as to such forecasts or the assumptions on which they are based. The information set forth herein is based upon economic, monetary, market and other conditions as in effect on, and the information made available to us as of, the date hereof, unless indicated otherwise and Centerview assumes no obligation to update or otherwise revise these materials. The financial analysis in this presentation is complex and is not necessarily susceptible to a partial analysis or summary description. In performing this financial analysis, Centerview has considered the results of its analysis as a whole and did not necessarily attribute a particular weight to any particular portion of the analysis considered. Furthermore, selecting any portion of Centerview’s analysis, without consideri ng the analysis as a whole, would create an incomplete view of the process underlying its financial analysis. Centerview may have deemed various a ssumptions more or less probable than other assumptions, so the reference ranges resulting from any particular portion of the analysis described above should not be taken to be Centerview’s view of the actual value of Telluride. These materials and the information contained herein are confidential, were not prepared with a view toward public disclosure , and may not be disclosed publicly or made available to third parties without the prior written consent of Centerview. These materials and an y other advice, written or oral, rendered by Centerview are intended solely for the benefit and use of the Special Committee of the Board of Directors of Telluride (in its capacity as such) in its consideration of strategic alternatives, and are not for the benefit of, and do not convey any rights or remedies for any holder of securities of Telluride or any other person. Centerview will not be responsible for and has not provided any tax, accounting, actuarial, legal or other specialist advice. These materials are not intended to provide the sole basis for evalu ating strategic alternatives, and this presentation does not represent a fairness opinion, recommendation, valuation or opinion of any kind, and is necessarily incomplete and should be viewed solely in conjunction with the oral presentation provided by Centerview. |
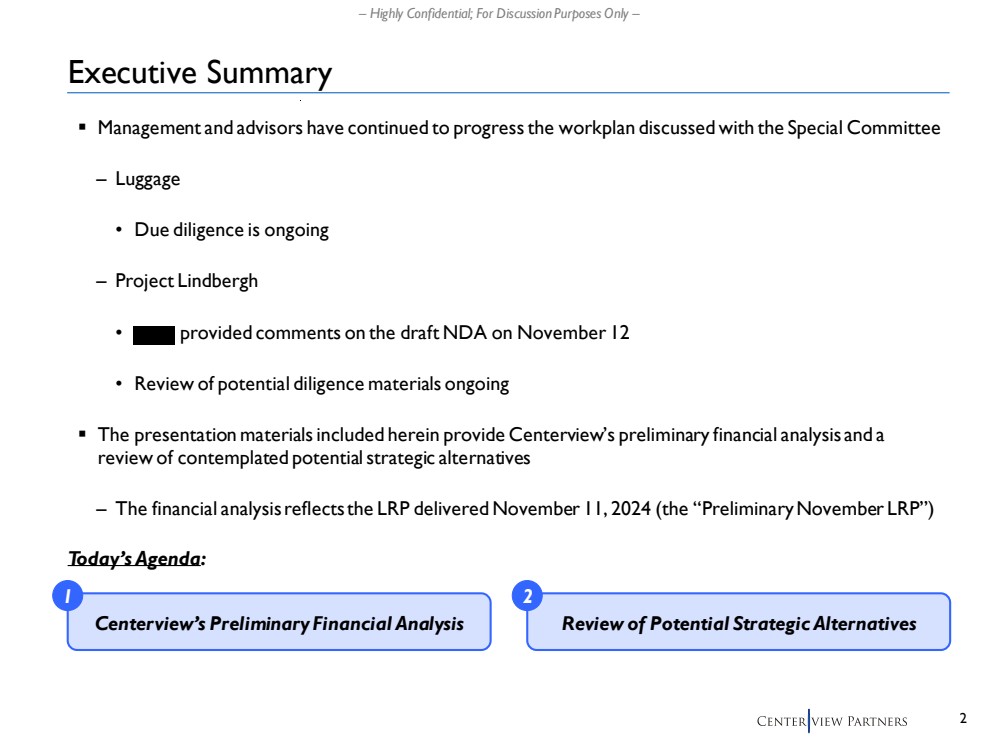
| 2 – Highly Confidential; For Discussion Purposes Only – Executive Summary ▪ Management and advisors have continued to progress the workplan discussed with the Special Committee – Luggage • Due diligence is ongoing – Project Lindbergh • provided comments on the draft NDA on November 12 • Review of potential diligence materials ongoing ▪ The presentation materials included herein provide Centerview’s preliminary financial analysis and a review of contemplated potential strategic alternatives – The financial analysis reflects the LRP delivered November 11, 2024 (the “Preliminary November LRP”) Today’s Agenda: Centerview’s Preliminary Financial Analysis Review of Potential Strategic Alternatives 1 2 |
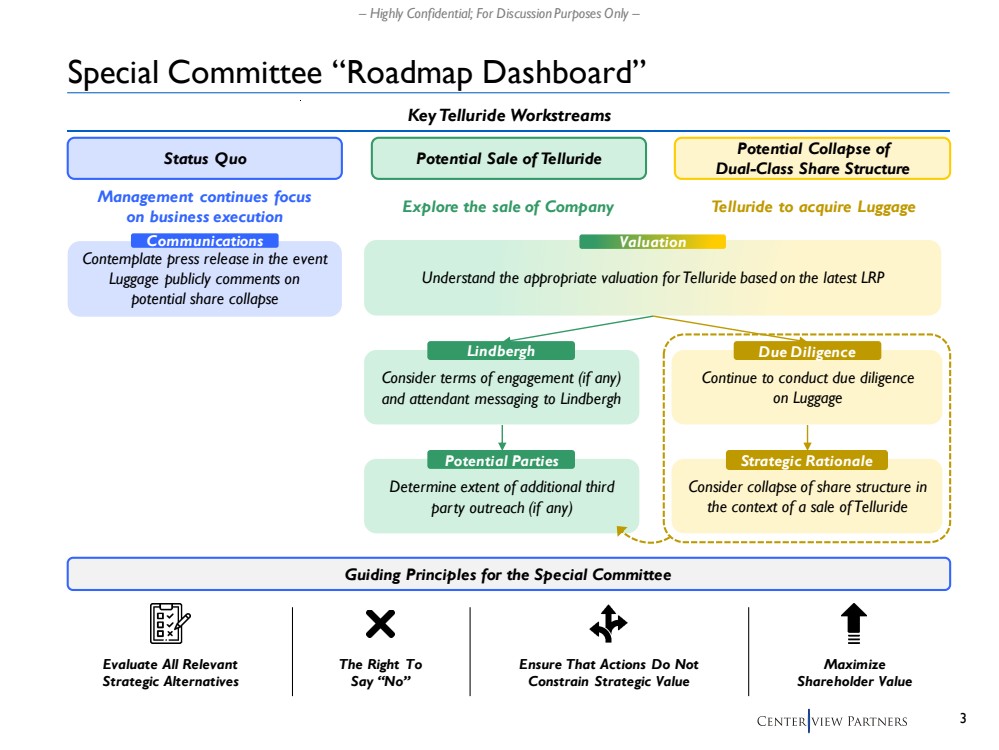
| 3 – Highly Confidential; For Discussion Purposes Only – Special Committee “Roadmap Dashboard” Status Quo Potential Sale of Telluride Potential Collapse of Dual-Class Share Structure Understand the appropriate valuation for Telluride based on the latest LRP Management continues focus on business execution Explore the sale of Company Telluride to acquire Luggage Determine extent of additional third party outreach (if any) Potential Parties Continue to conduct due diligence on Luggage Due Diligence Key Telluride Workstreams Valuation Contemplate press release in the event Luggage publicly comments on potential share collapse Communications Consider terms of engagement (if any) and attendant messaging to Lindbergh Lindbergh Consider collapse of share structure in the context of a sale of Telluride Strategic Rationale Guiding Principles for the Special Committee The Right To Say “No” Ensure That Actions Do Not Constrain Strategic Value Maximize Shareholder Value Evaluate All Relevant Strategic Alternatives |
| 1 Centerview’s Preliminary Financial Analysis |
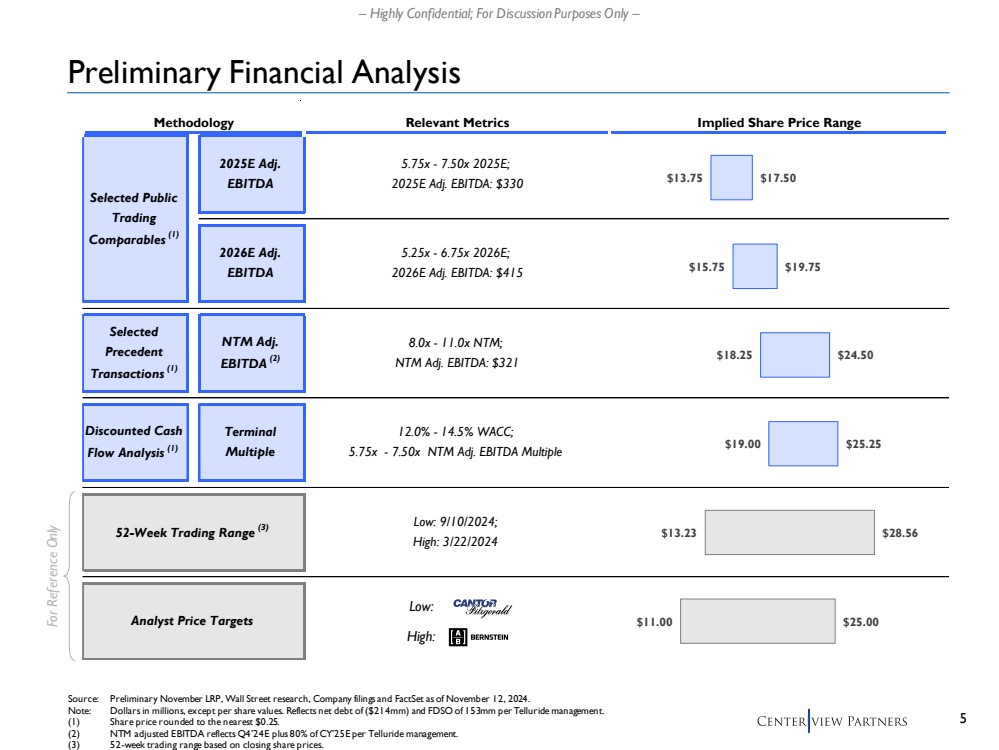
| 5 – Highly Confidential; For Discussion Purposes Only – Methodology Relevant Metrics Implied Share Price Range 52-Week Trading Range (3) Analyst Price Targets Discounted Cash Flow Analysis (1) Terminal Multiple 2025E Adj. EBITDA Selected Precedent Transactions (1) NTM Adj. EBITDA (2) 2026E Adj. EBITDA Selected Public Trading Comparables (1) 12.0% - 14.5% WACC; 5.75x - 7.50x NTM Adj. EBITDA Multiple 5.75x - 7.50x 2025E; 2025E Adj. EBITDA: $330 8.0x - 11.0x NTM; NTM Adj. EBITDA: $321 Low: 9/10/2024; High: 3/22/2024 5.25x - 6.75x 2026E; 2026E Adj. EBITDA: $415 $13.75 $15.75 $18.25 $19.00 $13.23 $11.00 $17.50 $19.75 $24.50 $25.25 $28.56 $25.00 Preliminary Financial Analysis Source: Preliminary November LRP, Wall Street research, Company filings and FactSet as of November 12, 2024. Note: Dollars in millions, except per share values. Reflects net debt of ($214mm) and FDSO of 153mm per Telluride management. (1) Share price rounded to the nearest $0.25. (2) NTM adjusted EBITDA reflects Q4’24E plus 80% of CY’25E per Telluride management. (3) 52-week trading range based on closing share prices. For Reference Only Low: High: |
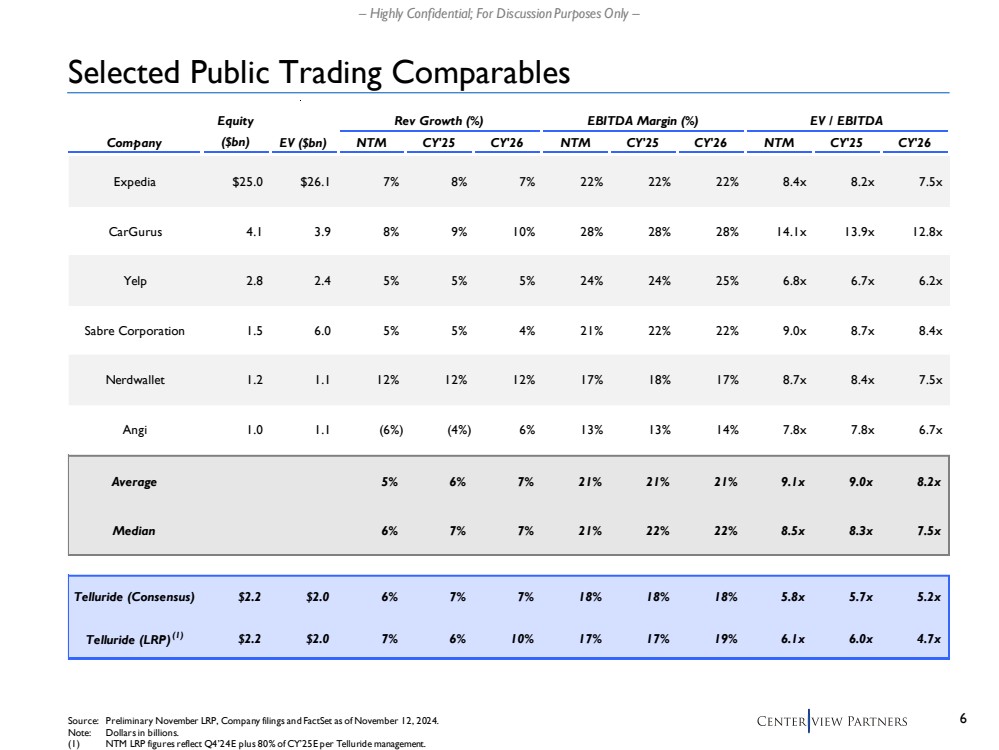
| 6 – Highly Confidential; For Discussion Purposes Only – Selected Public Trading Comparables Source: Preliminary November LRP, Company filings and FactSet as of November 12, 2024. Note: Dollars in billions. (1) NTM LRP figures reflect Q4’24E plus 80% of CY’25E per Telluride management. Equity Rev Growth (%) EBITDA Margin (%) EV / EBITDA Company Value ($bn) EV ($bn) NTM CY'25 CY'26 NTM CY'25 CY'26 NTM CY'25 CY'26 Expedia $25.0 $26.1 7 % 8 % 7 % 22% 22% 22% 8.4x 8.2x 7.5x CarGurus 4.1 3.9 8 % 9 % 10% 28% 28% 28% 14.1x 13.9x 12.8x Yelp 2.8 2.4 5 % 5 % 5 % 24% 24% 25% 6.8x 6.7x 6.2x Sabre Corporation 1.5 6.0 5 % 5 % 4 % 21% 22% 22% 9.0x 8.7x 8.4x Nerdwallet 1.2 1.1 12% 12% 12% 17% 18% 17% 8.7x 8.4x 7.5x Angi 1.0 1.1 (6%) (4%) 6 % 13% 13% 14% 7.8x 7.8x 6.7x Average 5% 6% 7% 21% 21% 21% 9.1x 9.0x 8.2x Median 6% 7% 7% 21% 22% 22% 8.5x 8.3x 7.5x Telluride (Consensus) $2.2 $2.0 6% 7% 7% 18% 18% 18% 5.8x 5.7x 5.2x Telluride (LRP)(1) $2.2 $2.0 7% 6% 10% 17% 17% 19% 6.1x 6.0x 4.7x |
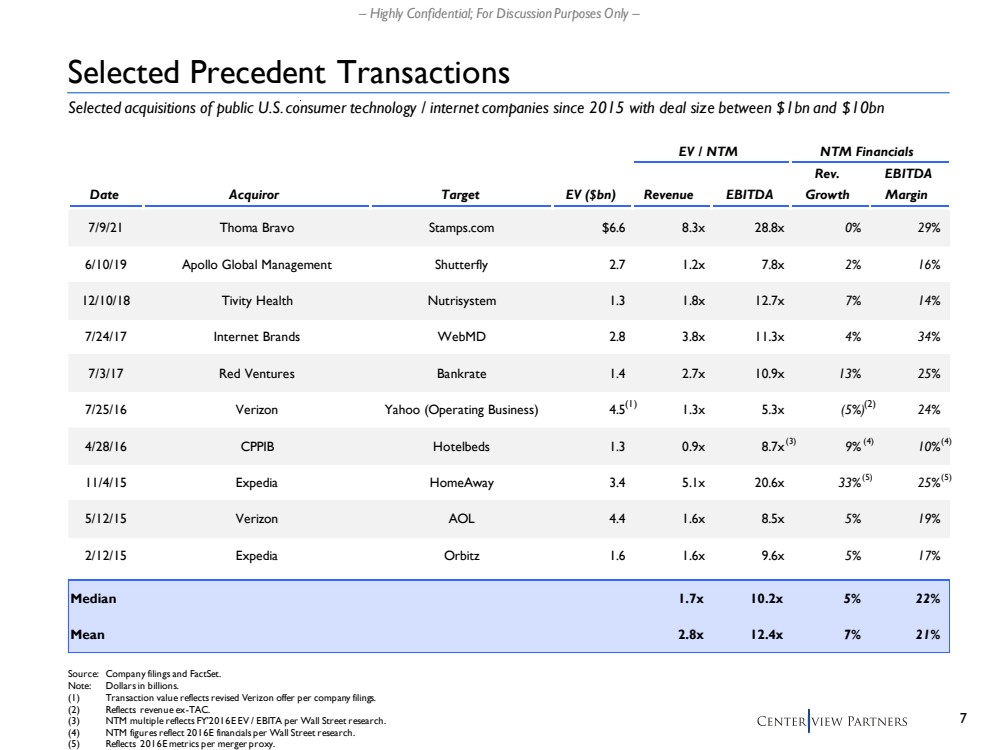
| 7 – Highly Confidential; For Discussion Purposes Only – EV / NTM NTM Financials Rev. EBITDA Date Acquiror Target EV ($bn) Revenue EBITDA Growth Margin 7/9/21 Thoma Bravo Stamps.com $6.6 8.3x 28.8x 0% 29% 6/10/19 Apollo Global Management Shutterfly 2.7 1.2x 7.8x 2% 16% 12/10/18 Tivity Health Nutrisystem 1.3 1.8x 12.7x 7% 14% 7/24/17 Internet Brands WebMD 2.8 3.8x 11.3x 4% 34% 7/3/17 Red Ventures Bankrate 1.4 2.7x 10.9x 13% 25% 7/25/16 Verizon Yahoo (Operating Business) 4.5 1.3x 5.3x (5%) 24% 4/28/16 CPPIB Hotelbeds 1.3 0.9x 8.7x 9% 10% 11/4/15 Expedia HomeAway 3.4 5.1x 20.6x 33% 25% 5/12/15 Verizon AOL 4.4 1.6x 8.5x 5% 19% 2/12/15 Expedia Orbitz 1.6 1.6x 9.6x 5% 17% Median 1.7x 10.2x 5 % 22% Mean 2.8x 12.4x 7 % 21% Selected Precedent Transactions Source: Company filings and FactSet. Note: Dollars in billions. (1) Transaction value reflects revised Verizon offer per company filings. (2) Reflects revenue ex-TAC. (3) NTM multiple reflects FY’2016E EV / EBITA per Wall Street research. (4) NTM figures reflect 2016E financials per Wall Street research. (5) Reflects 2016E metrics per merger proxy. Selected acquisitions of public U.S. consumer technology / internet companies since 2015 with deal size between $1bn and $10bn (3) (1) (2) (4) (4) (5) (5) |
| 8 – Highly Confidential; For Discussion Purposes Only – Source: Preliminary November LRP. Note: Dollars in millions. Valuation as of September 30, 2024. Reflects net debt of ($214mm) and FDSO of 153mm per Telluride management. Assumes mid-period discounting convention. Tax rate as provided by Telluride management. (1) Reflects projected cash inflow in Q4’24E due to estimated overpayment of taxes in Q1-Q3’24. (2) Share price rounded to the nearest $0.25. Discounted Cash Flow Analysis Enterprise Value ($mm) Implied Share Price(2) Discount Terminal NTM EBITDA Multiple Terminal NTM EBITDA Multiple Rate 5.75x 6.63x 7.50x 12.0% $2,956 $3,292 $3,628 13.3% $2,809 $3,126 $3,442 14.5% $2,671 $2,970 $3,269 Terminal NTM EBITDA Multiple Terminal NTM EBITDA Multiple 5.75x 6.63x 7.50x $20.75 $23.00 $25.25 $19.75 $21.75 $24.00 $19.00 $20.75 $22.75 Fiscal Year Ending December 31, Terminal Q4'2024E 2025E 2026E 2027E 2028E 2029E Year (NTM) Revenue $394 $1,930 $2,130 $2,340 $2,540 $2,740 $2,956 % Growth 1% 6% 10% 10% 9% 8% EBITDA $57 $330 $415 $485 $560 $645 $696 % Margin 15% 17% 19% 21% 22% 24% (-) D&A ($28) ($97) ($85) ($94) ($102) ($110) (-) SBC (35) (135) (149) (164) (178) (192) Burdened EBIT ($6) $98 $181 $228 $281 $344 % Margin (1%) 5% 8% 10% 11% 13% (-) Taxes(1) $34 ($25) ($45) ($57) ($70) ($86) Tax Rate % n.m. 25% 25% 25% 25% 25% NOPAT $28 $74 $136 $171 $210 $258 (+) D&A 28 97 85 94 102 110 (+) ∆ in NWC 21 19 21 23 25 27 (-) CapEx (22) (77) (85) (94) (102) (110) Unlevered Free Cash Flow $56 $112 $157 $194 $236 $285 % Margin 14% 6% 7% 8% 9% 10% |

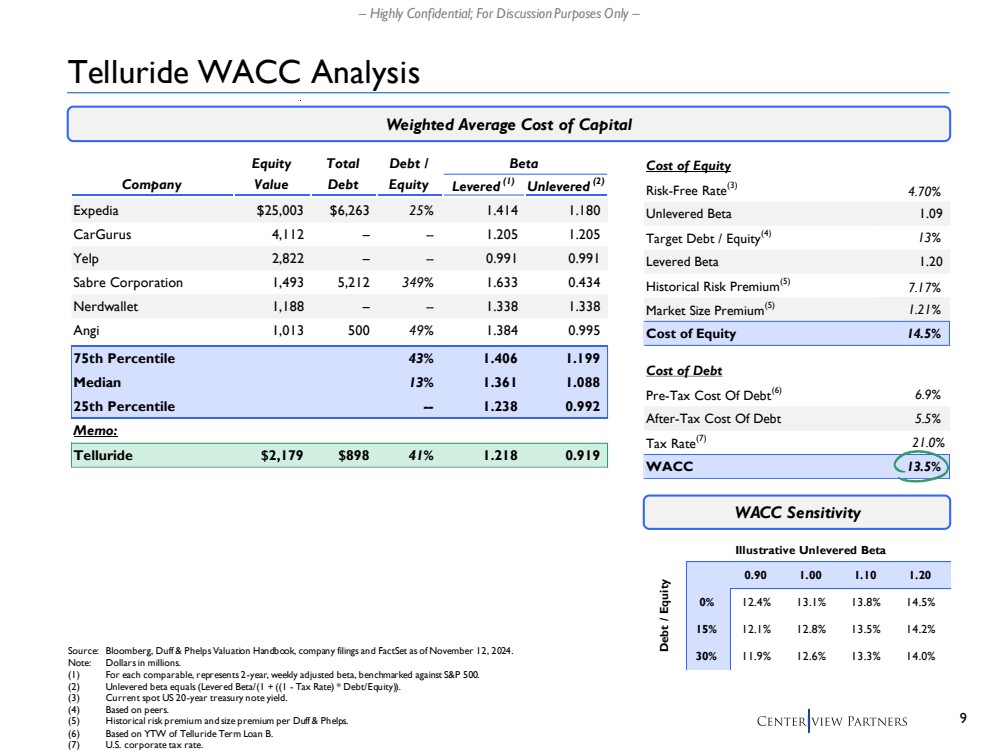
| 9 – Highly Confidential; For Discussion Purposes Only – Cost of Equity Risk-Free Rate(3) 4.70% Unlevered Beta 1.09 Target Debt / Equity(4) 13% Levered Beta 1.20 Historical Risk Premium(5) 7.17% Market Size Premium(5) 1.21% Cost of Equity 14.5% Cost of Debt Pre-Tax Cost Of Debt(6) 6.9% After-Tax Cost Of Debt 5.5% Tax Rate(7) 21.0% WACC 13.5% Telluride WACC Analysis Source: Bloomberg, Duff & Phelps Valuation Handbook, company filings and FactSet as of November 12, 2024. Note: Dollars in millions. (1) For each comparable, represents 2-year, weekly adjusted beta, benchmarked against S&P 500. (2) Unlevered beta equals (Levered Beta/(1 + ((1 - Tax Rate) * Debt/Equity)). (3) Current spot US 20-year treasury note yield. (4) Based on peers. (5) Historical risk premium and size premium per Duff & Phelps. (6) Based on YTW of Telluride Term Loan B. (7) U.S. corporate tax rate. Weighted Average Cost of Capital WACC Sensitivity Illustrative Unlevered Beta 13% 0.90 1.00 1.10 1.20 0% 12.4% 13.1% 13.8% 14.5% 15% 12.1% 12.8% 13.5% 14.2% 30% 11.9% 12.6% 13.3% 14.0% Debt / Equity Equity Total Debt / Beta Company Value Debt Equity Levered (1) Unlevered (2) Expedia $25,003 $6,263 25% 1.414 1.180 CarGurus 4,112 – -- 1.205 1.205 Yelp 2,822 – -- 0.991 0.991 Sabre Corporation 1,493 5,212 349% 1.633 0.434 Nerdwallet 1,188 – -- 1.338 1.338 Angi 1,013 500 49% 1.384 0.995 75th Percentile 43% 1.406 1.199 Median 13% 1.361 1.088 25th Percentile -- 1.238 0.992 Memo: Telluride $2,179 $898 41% 1.218 0.919 |
| 2 Review of Potential Strategic Alternatives |
| 11 – Highly Confidential; For Discussion Purposes Only – Evaluation of Potential Uses of Capital Organic Investment Share Repurchases M&A Benefits ✓ Allows Telluride to enhance its competitive position by strengthening its core capabilities ✓ Investments can be more closely aligned with strategic priorities, with management maintaining greater control over timelines and outcomes ✓ Can signal management’s confidence in the Company’s performance / future outlook ✓ Increases EPS with potential to improve valuation, benefitting existing shareholders ✓ Provides immediate access to new markets or products, providing near-term impact to financial profile (e.g., revenue growth) ✓ Strong M&A opportunity can unlock revenue and cost synergy benefits Considerations ? Preliminary November LRP already accounts for organic investments ? Unclear magnitude and timing of return on investment ? Timing and business performance ? Does not fundamentally impact the operations of the business ? Increases interests of Luggage ? Understanding actionability of potential M&A pipeline ? Risk of integration challenges that could be disruptive to the business Opportunity ▪ Telluride has ~$1.1bn of cash on hand and ~$200mm remaining under its $250mm share repurchase program ▪ Significant cash balance provides Telluride optionality for how it chooses to allocate its capital |

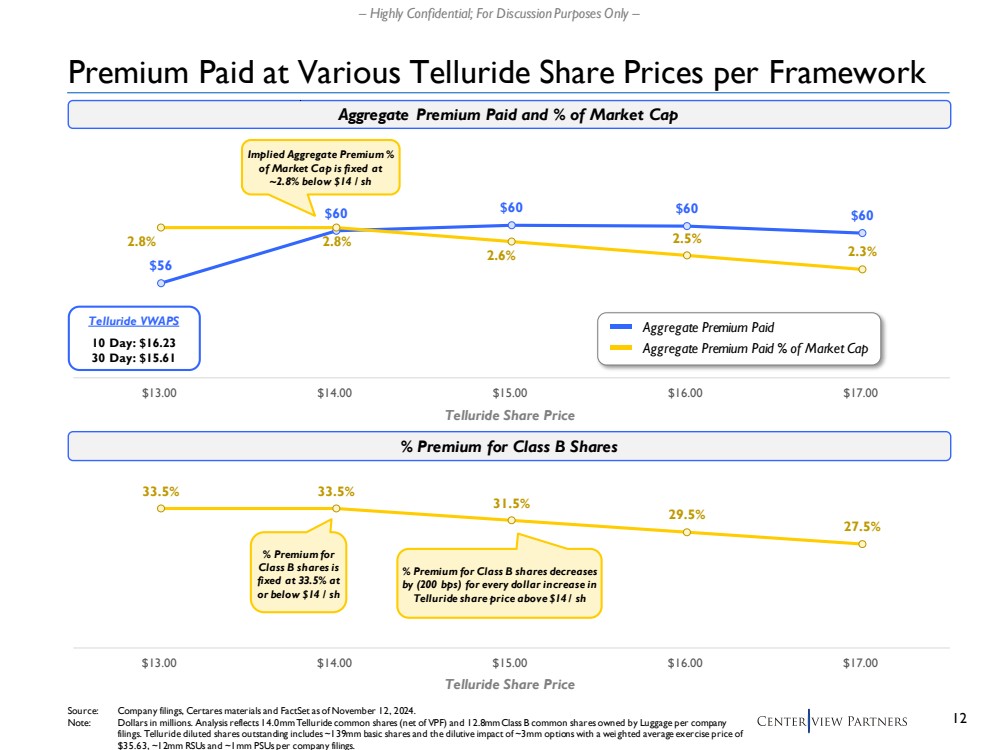
| 12 – Highly Confidential; For Discussion Purposes Only – Premium Paid at Various Telluride Share Prices per Framework Source: Company filings, Certares materials and FactSet as of November 12, 2024. Note: Dollars in millions. Analysis reflects 14.0mm Telluride common shares (net of VPF) and 12.8mm Class B common shares owned by Luggage per company filings. Telluride diluted shares outstanding includes ~139mm basic shares and the dilutive impact of ~3mm options with a wei ghted average exercise price of $35.63, ~12mm RSUs and ~1mm PSUs per company filings. Aggregate Premium Paid and % of Market Cap $56 $60 $60 $60 $60 2.8% 2.8% 2.6% 2.5% 2.3% $13.00 $14.00 $15.00 $16.00 $17.00 Telluride Share Price % Premium for Class B Shares 33.5% 33.5% 31.5% 29.5% 27.5% $13.00 $14.00 $15.00 $16.00 $17.00 Telluride Share Price Aggregate Premium Paid Aggregate Premium Paid % of Market Cap Implied Aggregate Premium % of Market Cap is fixed at ~2.8% below $14 / sh % Premium for Class B shares is fixed at 33.5% at or below $14 / sh % Premium for Class B shares decreases by (200 bps) for every dollar increase in Telluride share price above $14 / sh Telluride VWAPS 10 Day: $16.23 30 Day: $15.61 |
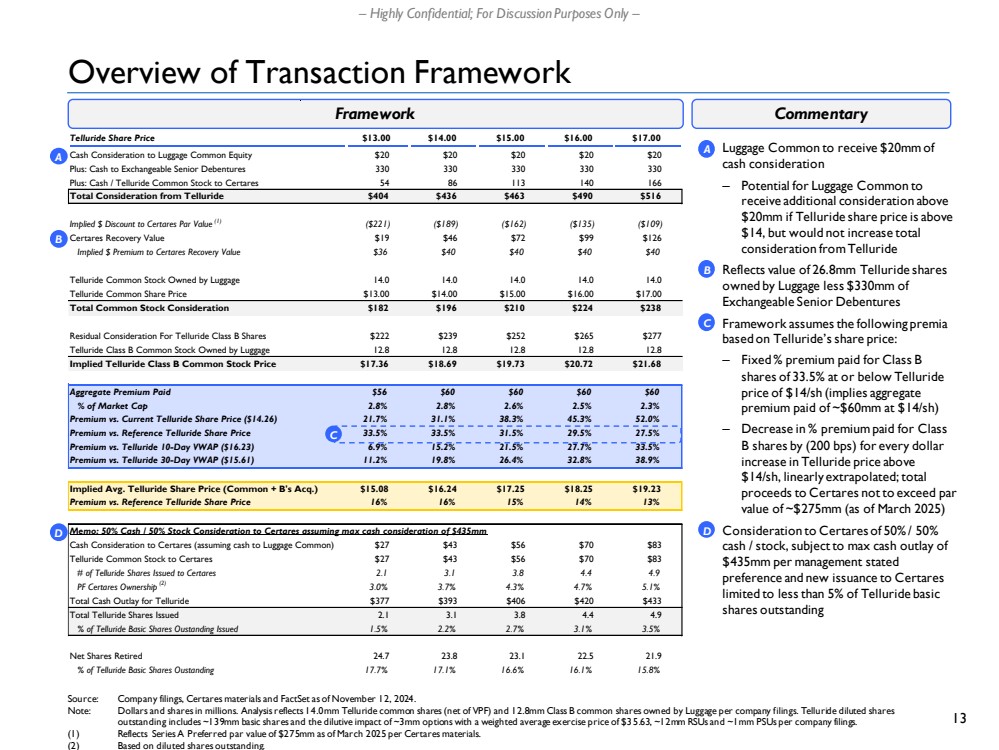
| 13 – Highly Confidential; For Discussion Purposes Only – Telluride Share Price $13.00 $14.00 $15.00 $16.00 $17.00 Cash Consideration to Luggage Common Equity $20 $20 $20 $20 $20 Plus: Cash to Exchangeable Senior Debentures 330 330 330 330 330 Plus: Cash / Telluride Common Stock to Certares 54 86 113 140 166 Total Consideration from Telluride $404 $436 $463 $490 $516 Implied $ Discount to Certares Par Value (1) ($221) ($189) ($162) ($135) ($109) Certares Recovery Value $19 $46 $72 $99 $126 Implied $ Premium to Certares Recovery Value $36 $40 $40 $40 $40 Telluride Common Stock Owned by Luggage 14.0 14.0 14.0 14.0 14.0 Telluride Common Share Price $13.00 $14.00 $15.00 $16.00 $17.00 Total Common Stock Consideration $182 $196 $210 $224 $238 Residual Consideration For Telluride Class B Shares $222 $239 $252 $265 $277 Telluride Class B Common Stock Owned by Luggage 12.8 12.8 12.8 12.8 12.8 Implied Telluride Class B Common Stock Price $17.36 $18.69 $19.73 $20.72 $21.68 Aggregate Premium Paid $56 $60 $60 $60 $60 % of Market Cap 2.8% 2.8% 2.6% 2.5% 2.3% Premium vs. Current Telluride Share Price ($14.26) 21.7% 31.1% 38.3% 45.3% 52.0% Premium vs. Reference Telluride Share Price 33.5% 33.5% 31.5% 29.5% 27.5% Premium vs. Telluride 10-Day VWAP ($16.23) 6.9% 15.2% 21.5% 27.7% 33.5% Premium vs. Telluride 30-Day VWAP ($15.61) 11.2% 19.8% 26.4% 32.8% 38.9% Implied Avg. Telluride Share Price (Common + B's Acq.) $15.08 $16.24 $17.25 $18.25 $19.23 Premium vs. Reference Telluride Share Price 16% 16% 15% 14% 13% Memo: 50% Cash / 50% Stock Consideration to Certares assuming max cash consideration of $435mm Cash Consideration to Certares (assuming cash to Luggage Common) $27 $43 $56 $70 $83 Telluride Common Stock to Certares $27 $43 $56 $70 $83 # of Telluride Shares Issued to Certares 2.1 3.1 3.8 4.4 4.9 PF Certares Ownership (2) 3.0% 3.7% 4.3% 4.7% 5.1% Total Cash Outlay for Telluride $377 $393 $406 $420 $433 Total Telluride Shares Issued 2.1 3.1 3.8 4.4 4.9 % of Telluride Basic Shares Oustanding Issued 1.5% 2.2% 2.7% 3.1% 3.5% Net Shares Retired 24.7 23.8 23.1 22.5 21.9 % of Telluride Basic Shares Oustanding 17.7% 17.1% 16.6% 16.1% 15.8% ▪ Luggage Common to receive $20mm of cash consideration – Potential for Luggage Common to receive additional consideration above $20mm if Telluride share price is above $14, but would not increase total consideration from Telluride ▪ Reflects value of 26.8mm Telluride shares owned by Luggage less $330mm of Exchangeable Senior Debentures ▪ Framework assumes the following premia based on Telluride’s share price: – Fixed % premium paid for Class B shares of 33.5% at or below Telluride price of $14/sh (implies aggregate premium paid of ~$60mm at $14/sh) – Decrease in % premium paid for Class B shares by (200 bps) for every dollar increase in Telluride price above $14/sh, linearly extrapolated; total proceeds to Certares not to exceed par value of ~$275mm (as of March 2025) ▪ Consideration to Certaresof 50% / 50% cash / stock, subject to max cash outlay of $435mm per management stated preference and new issuance to Certares limited to less than 5% of Telluride basic shares outstanding Overview of Transaction Framework Source: Company filings, Certares materials and FactSet as of November 12, 2024. Note: Dollars and shares in millions. Analysis reflects 14.0mm Telluride common shares (net of VPF) and 12.8mm Class B common shares owned by Luggage per company filings. Telluride diluted shares outstanding includes ~139mm basic shares and the dilutive impact of ~3mm options with a weighted average exercise price of $3 5.63, ~12mm RSUs and ~1mm PSUs per company filings. (1) Reflects Series A Preferred par value of $275mm as of March 2025 per Certares materials. (2) Based on diluted shares outstanding. Framework Commentary B A A C D D B C |
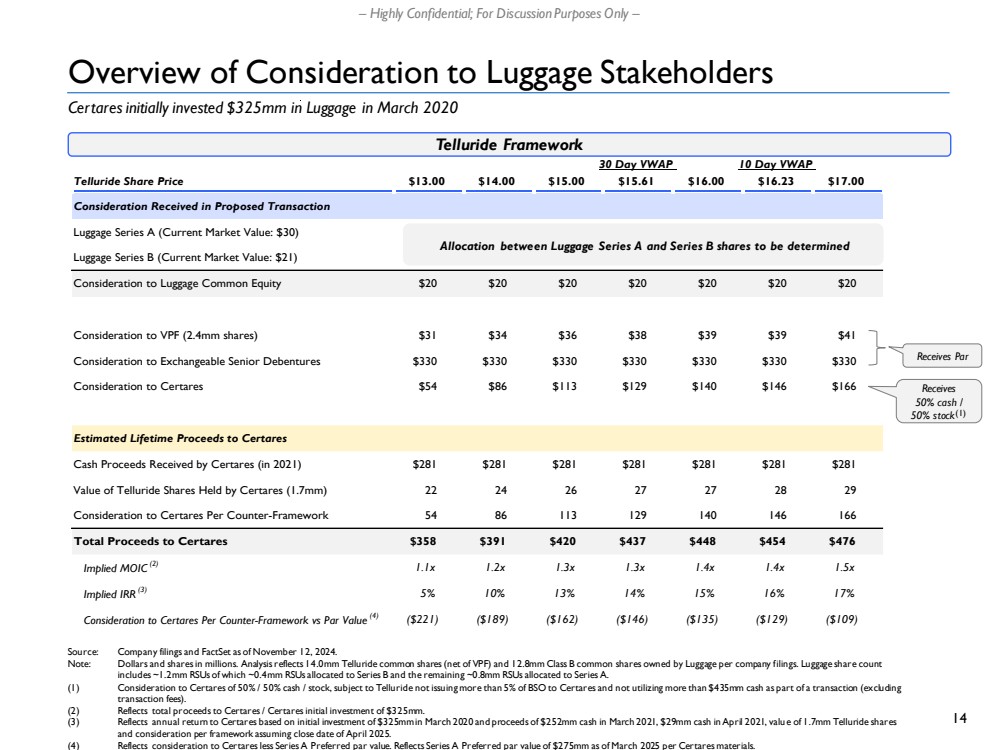
| 14 – Highly Confidential; For Discussion Purposes Only – Overview of Consideration to Luggage Stakeholders Source: Company filings and FactSet as of November 12, 2024. Note: Dollars and shares in millions. Analysis reflects 14.0mm Telluride common shares (net of VPF) and 12.8mm Class B common shares owned by Luggage per company filings. Luggage share count includes ~1.2mm RSUs of which ~0.4mm RSUs allocated to Series B and the remaining ~0.8mm RSUs allocated to Series A. (1) Consideration to Certares of 50% / 50% cash / stock, subject to Telluride not issuing more than 5% of BSO to Certares and not utilizing more than $435mm cash as part of a transaction (excluding transaction fees). (2) Reflects total proceeds to Certares/ Certaresinitial investment of $325mm. (3) Reflects annual return to Certares based on initial investment of $325mm in March 2020 and proceeds of $252mm cash in March 2021, $29mm cash in April 2021, valu e of 1.7mm Telluride shares and consideration per framework assuming close date of April 2025. (4) Reflects consideration to Certaresless Series A Preferred par value. Reflects Series A Preferred par value of $275mm as of March 2025 per Certares materials. Receives Par Receives 50% cash / 50% stock(1) Telluride Framework 30 Day VWAP 10 Day VWAP Telluride Share Price $13.00 $14.00 $15.00 $15.61 $16.00 $16.23 $17.00 Consideration Received in Proposed Transaction Luggage Series A (Current Market Value: $30) Luggage Series B (Current Market Value: $21) Consideration to Luggage Common Equity $20 $20 $20 $20 $20 $20 $20 Consideration to VPF (2.4mm shares) $31 $34 $36 $38 $39 $39 $41 Consideration to Exchangeable Senior Debentures $330 $330 $330 $330 $330 $330 $330 Consideration to Certares $54 $86 $113 $129 $140 $146 $166 Estimated Lifetime Proceeds to Certares Cash Proceeds Received by Certares (in 2021) $281 $281 $281 $281 $281 $281 $281 Value of Telluride Shares Held by Certares (1.7mm) 22 24 26 27 27 28 29 Consideration to Certares Per Counter-Framework 54 86 113 129 140 146 166 Total Proceeds to Certares $358 $391 $420 $437 $448 $454 $476 Implied MOIC (2) 1.1x 1.2x 1.3x 1.3x 1.4x 1.4x 1.5x Implied IRR (3) 5% 10% 13% 14% 15% 16% 17% Consideration to Certares Per Counter-Framework vs Par Value (4) ($221) ($189) ($162) ($146) ($135) ($129) ($109) Certares initially invested $325mm in Luggage in March 2020 Allocation between Luggage Series A and Series B shares to be determined |
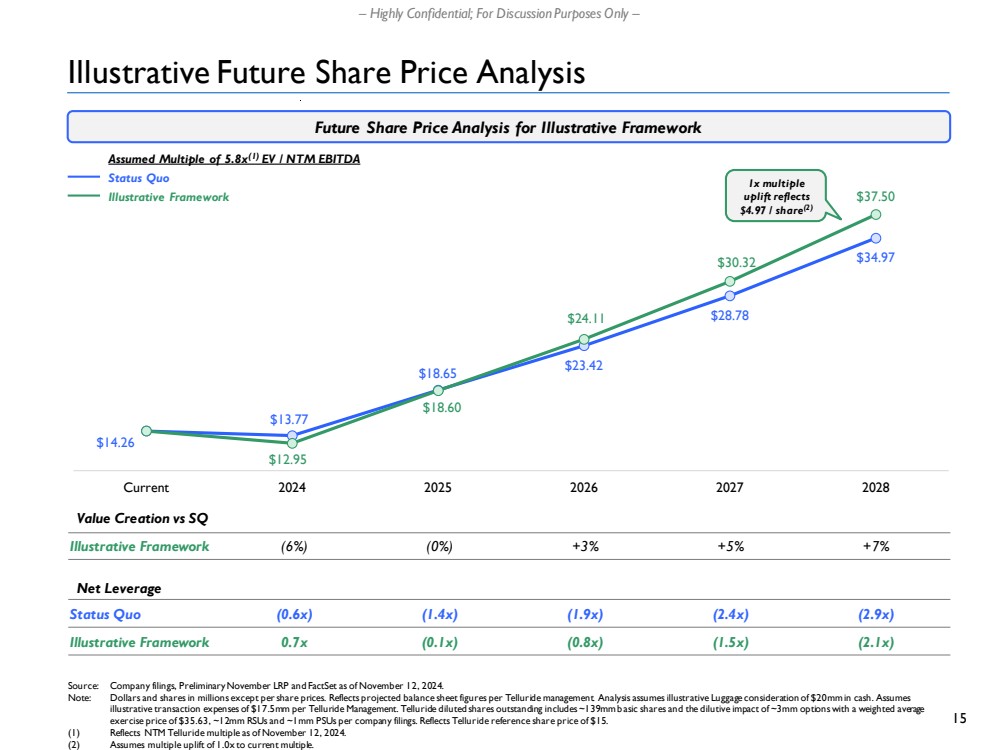
| 15 – Highly Confidential; For Discussion Purposes Only – $14.26 $13.77 $18.65 $23.42 $28.78 $34.97 $12.95 $18.60 $24.11 $30.32 $37.50 Current 2024 2025 2026 2027 2028 Illustrative Future Share Price Analysis Value Creation vs SQ Net Leverage Status Quo (0.6x) (1.4x) (1.9x) Assumed Multiple of 5.8x(1) EV / NTM EBITDA Status Quo Illustrative Framework Future Share Price Analysis for Illustrative Framework (2.4x) 1x multiple uplift reflects $4.97 / share(2) Source: Company filings, Preliminary November LRP and FactSet as of November 12, 2024. Note: Dollars and shares in millions except per share prices. Reflects projected balance sheet figures per Telluride management. Analysis assumes illustrative Luggage consideration of $20mm in cash. Assumes illustrative transaction expenses of $17.5mm per Telluride Management. Telluride diluted shares outstanding includes ~139mm b asic shares and the dilutive impact of ~3mm options with a weighted average exercise price of $35.63, ~12mm RSUs and ~1mm PSUs per company filings. Reflects Telluride reference share price of $15. (1) Reflects NTM Telluride multiple as of November 12, 2024. (2) Assumes multiple uplift of 1.0x to current multiple. Illustrative Framework (6%) (0%) +3% +5% Illustrative Framework 0.7x (0.1x) (0.8x) (1.5x) (2.9x) +7% (2.1x) |
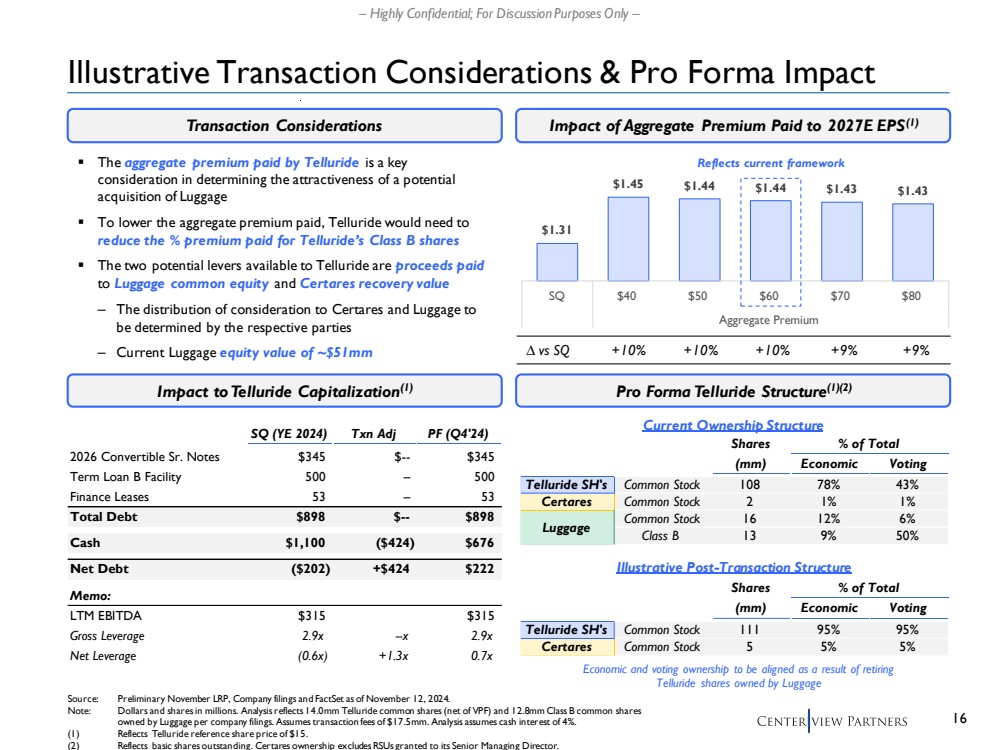
| 16 – Highly Confidential; For Discussion Purposes Only – Illustrative Transaction Considerations & Pro Forma Impact Source: Preliminary November LRP, Company filings and FactSet as of November 12, 2024. Note: Dollars and shares in millions. Analysis reflects 14.0mm Telluride common shares (net of VPF) and 12.8mm Class B common shares owned by Luggage per company filings. Assumes transaction fees of $17.5mm. Analysis assumes cash interest of 4%. (1) Reflects Telluride reference share price of $15. (2) Reflects basic shares outstanding. Certares ownership excludes RSUs granted to its Senior Managing Director. Transaction Considerations Impact of Aggregate Premium Paid to 2027E EPS(1) Impact to Telluride Capitalization(1) Pro Forma Telluride Structure(1)(2) $1.31 $1.45 $1.44 $1.44 $1.43 $1.43 SQ $40 $50 $60 $70 $80 Aggregate Premium ∆ vs SQ +10% +10% +10% +9% +9% ▪ The aggregate premium paid by Telluride is a key Reflects current framework consideration in determining the attractiveness of a potential acquisition of Luggage ▪ To lower the aggregate premium paid, Telluride would need to reduce the % premium paid for Telluride’s Class B shares ▪ The two potential levers available to Telluride are proceeds paid to Luggage common equity and Certares recovery value – The distribution of consideration to Certares and Luggage to be determined by the respective parties – Current Luggage equity value of ~$51mm Current Ownership Structure Illustrative Post-Transaction Structure Shares % of Total (mm) Economic Voting Telluride SH's Common Stock 108 78% 43% Certares Common Stock 2 1% 1% Common Stock 16 12% 6% Class B 13 9% 50% Luggage Shares % of Total (mm) Economic Voting Telluride SH's Common Stock 111 95% 95% Certares Common Stock 5 5% 5% Economic and voting ownership to be aligned as a result of retiring Telluride shares owned by Luggage SQ (YE 2024) Txn Adj PF (Q4'24) 2026 Convertible Sr. Notes $345 $-- $345 Term Loan B Facility 500 – 500 Finance Leases 53 – 53 Total Debt $898 $-- $898 Cash $1,100 ($424) $676 Net Debt ($202) +$424 $222 Memo: LTM EBITDA $315 $315 Gross Leverage 2.9x --x 2.9x Net Leverage (0.6x) +1.3x 0.7x |
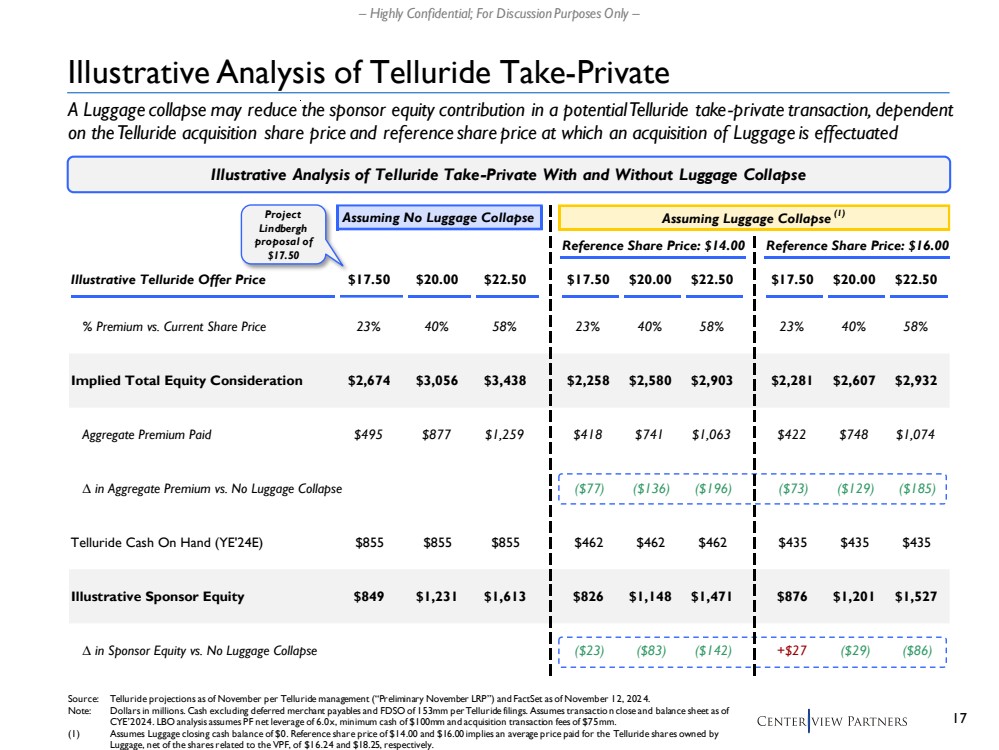
| 17 – Highly Confidential; For Discussion Purposes Only – Illustrative Analysis of Telluride Take-Private Illustrative Analysis of Telluride Take-Private With and Without Luggage Collapse Source: Telluride projections as of November per Telluride management (“Preliminary November LRP”) and FactSet as of November 12, 202 4. Note: Dollars in millions. Cash excluding deferred merchant payables and FDSO of 153mm per Telluride filings. Assumes transactio n close and balance sheet as of CYE’2024. LBO analysis assumes PF net leverage of 6.0x, minimum cash of $100mm and acquisition transaction fees of $75mm. (1) Assumes Luggage closing cash balance of $0. Reference share price of $14.00 and $16.00 implies an average price paid for the Telluride shares owned by Luggage, net of the shares related to the VPF, of $16.24 and $18.25, respectively. Project Lindbergh proposal of $17.50 A Luggage collapse may reduce the sponsor equity contribution in a potential Telluride take-private transaction, dependent on the Telluride acquisition share price and reference share price at which an acquisition of Luggage is effectuated Assuming No Luggage Collapse Assuming Luggage Collapse (1) Reference Share Price: $14.00 Reference Share Price: $16.00 Illustrative Telluride Offer Price $17.50 $20.00 $22.50 $17.50 $20.00 $22.50 $17.50 $20.00 $22.50 % Premium vs. Current Share Price 23% 40% 58% 23% 40% 58% 23% 40% 58% Implied Total Equity Consideration $2,674 $3,056 $3,438 $2,258 $2,580 $2,903 $2,281 $2,607 $2,932 Aggregate Premium Paid $495 $877 $1,259 $418 $741 $1,063 $422 $748 $1,074 ∆ in Aggregate Premium vs. No Luggage Collapse ($77) ($136) ($196) ($73) ($129) ($185) Telluride Cash On Hand (YE'24E) $855 $855 $855 $462 $462 $462 $435 $435 $435 Illustrative Sponsor Equity $849 $1,231 $1,613 $826 $1,148 $1,471 $876 $1,201 $1,527 ∆ in Sponsor Equity vs. No Luggage Collapse ($23) ($83) ($142) +$27 ($29) ($86) |
| Appendix Supplementary Materials |

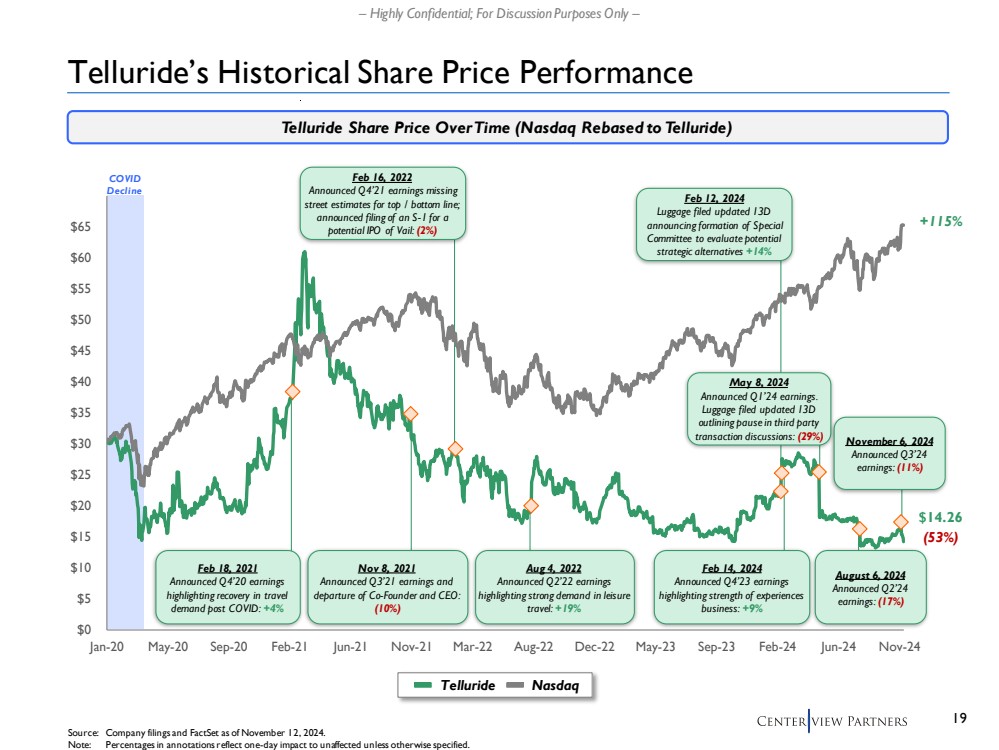
| 19 – Highly Confidential; For Discussion Purposes Only – COVID Decline Telluride’s Historical Share Price Performance Source: Company filings and FactSet as of November 12, 2024. Note: Percentages in annotations reflect one-day impact to unaffected unless otherwise specified. Telluride Share Price Over Time (Nasdaq Rebased to Telluride) Telluride Nasdaq Feb 18, 2021 Announced Q4’20 earnings highlighting recovery in travel demand post COVID: +4% Nov 8, 2021 Announced Q3’21 earnings and departure of Co-Founder and CEO: (10%) Feb 16, 2022 Announced Q4’21 earnings missing street estimates for top / bottom line; announced filing of an S-1 for a potential IPO of Vail: (2%) Aug 4, 2022 Announced Q2’22 earnings highlighting strong demand in leisure travel: +19% Feb 12, 2024 Luggage filed updated 13D announcing formation of Special Committee to evaluate potential strategic alternatives +14% Feb 14, 2024 Announced Q4’23 earnings highlighting strength of experiences business: +9% May 8, 2024 Announced Q1’24 earnings. Luggage filed updated 13D outlining pause in third party transaction discussions: (29%) August 6, 2024 Announced Q2’24 earnings: (17%) (53%) +115% $14.26 November 6, 2024 Announced Q3’24 earnings: (11%) $0 $5 $10 $15 $20 $25 $30 $35 $40 $45 $50 $55 $60 $65 Jan-20 May-20 Sep-20 Feb-21 Jun-21 Nov-21 Mar-22 Aug-22 Dec-22 May-23 Sep-23 Feb-24 Jun-24 Nov-24 |
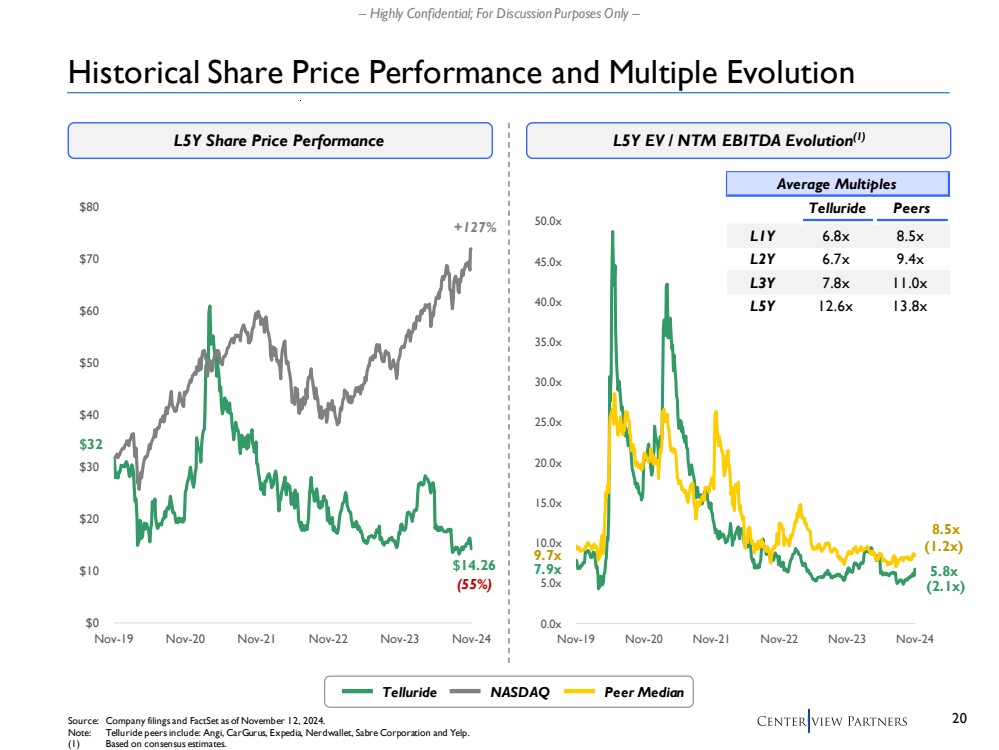
| 20 – Highly Confidential; For Discussion Purposes Only – 0.0x 5.0x 10.0x 15.0x 20.0x 25.0x 30.0x 35.0x 40.0x 45.0x 50.0x Nov-19 Nov-20 Nov-21 Nov-22 Nov-23 Nov-24 $0 $10 $20 $30 $40 $50 $60 $70 $80 Nov-19 Nov-20 Nov-21 Nov-22 Nov-23 Nov-24 Historical Share Price Performance and Multiple Evolution L5Y Share Price Performance L5Y EV / NTM EBITDA Evolution(1) Source: Company filings and FactSet as of November 12, 2024. Note: Telluride peers include: Angi, CarGurus, Expedia, Nerdwallet, Sabre Corporation and Yelp. (1) Based on consensus estimates. $32 $14.26 (55%) +127% 7.9x 8.5x (2.1x) 5.8x (1.2x) 9.7x Telluride NASDAQ Peer Median Average Multiples Telluride Peers L1Y 6.8x 8.5x L2Y 6.7x 9.4x L3Y 7.8x 11.0x L5Y 12.6x 13.8x |
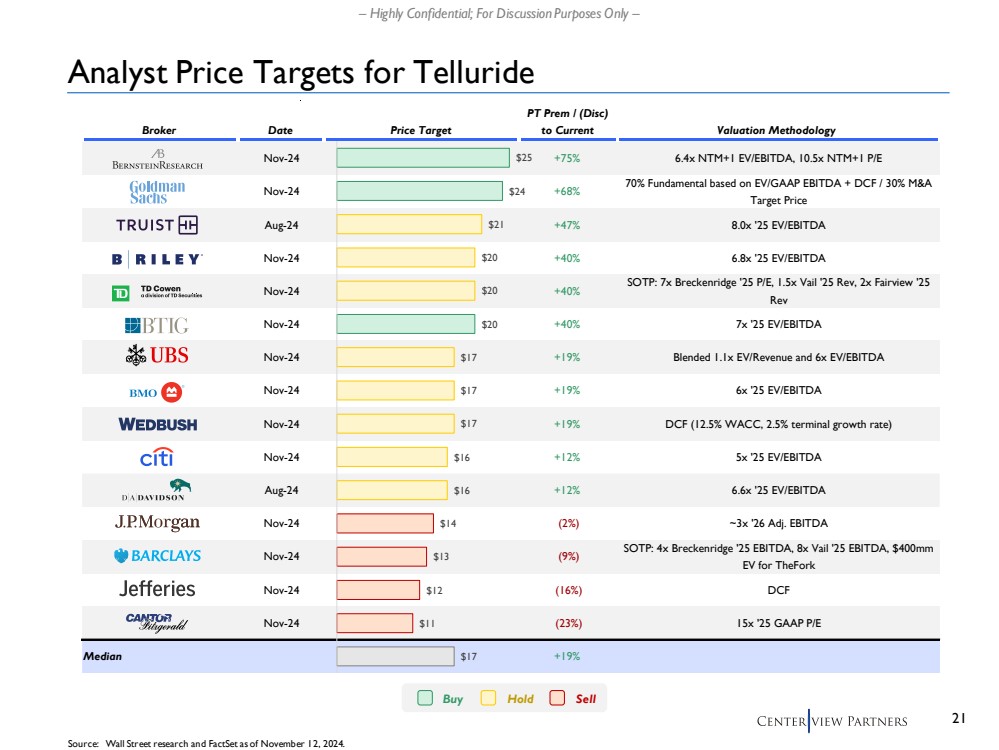
| 21 – Highly Confidential; For Discussion Purposes Only – PT Prem / (Disc) Broker Date Price Target to Current Valuation Methodology Nov-24 +75% 6.4x NTM+1 EV/EBITDA, 10.5x NTM+1 P/E Nov-24 +68% 70% Fundamental based on EV/GAAP EBITDA + DCF / 30% M&A Target Price Aug-24 +47% 8.0x '25 EV/EBITDA Nov-24 +40% 6.8x '25 EV/EBITDA Nov-24 +40% SOTP: 7x Breckenridge '25 P/E, 1.5x Vail '25 Rev, 2x Fairview '25 Rev Nov-24 +40% 7x '25 EV/EBITDA Nov-24 +19% Blended 1.1x EV/Revenue and 6x EV/EBITDA Nov-24 +19% 6x '25 EV/EBITDA Nov-24 +19% DCF (12.5% WACC, 2.5% terminal growth rate) Nov-24 +12% 5x '25 EV/EBITDA Aug-24 +12% 6.6x '25 EV/EBITDA Nov-24 (2%) ~3x '26 Adj. EBITDA Nov-24 (9%) SOTP: 4x Breckenridge '25 EBITDA, 8x Vail '25 EBITDA, $400mm EV for TheFork Nov-24 (16%) DCF Nov-24 (23%) 15x '25 GAAP P/E Median +19% $25 $24 $21 $20 $20 $20 $17 $17 $17 $16 $16 $14 $13 $12 $11 $17 Analyst Price Targets for Telluride Source: Wall Street research and FactSet as of November 12, 2024. Buy Hold Sell |
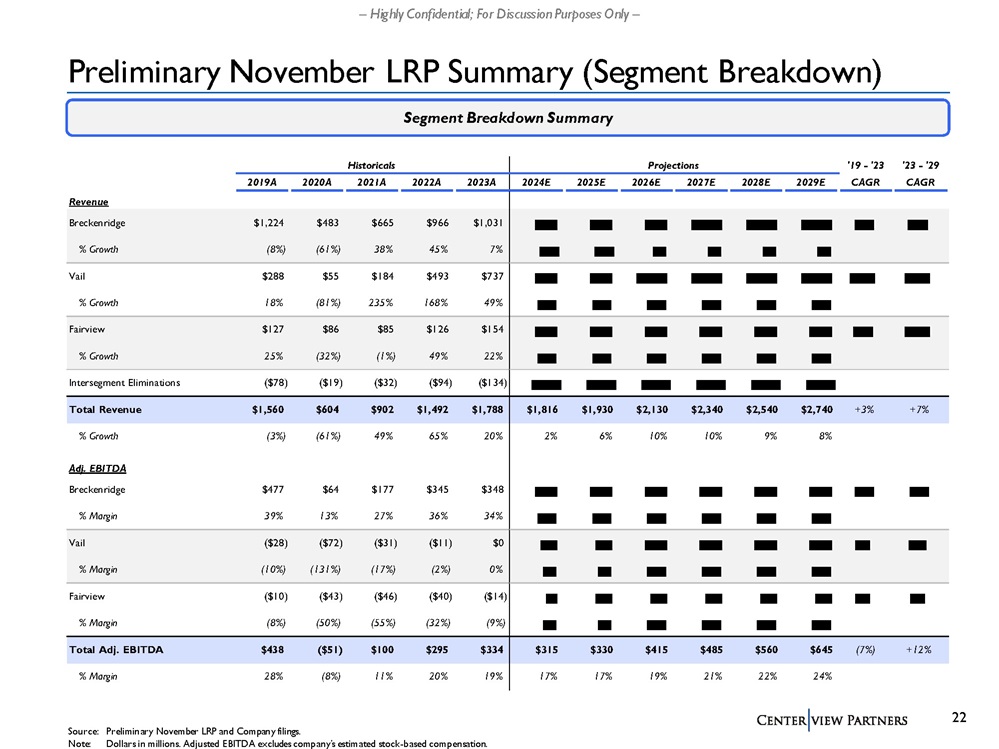
| 22 – Highly Confidential; For Discussion Purposes Only – Preliminary November LRP Summary (Segment Breakdown) Source: Preliminary November LRP and Company filings. Note: Dollars in millions. Adjusted EBITDA excludes company’s estimated stock-based compensation. Segment Breakdown Summary Historicals Projections '19 - '23 '23 - '29 2019A 2020A 2021A 2022A 2023A 2024E 2025E 2026E 2027E 2028E 2029E CAGR CAGR Revenue Breckenridge $1,224 $483 $665 $966 $1,031 % Growth (8%) (61%) 38% 45% 7% Vail $288 $55 $184 $493 $737 % Growth 18% (81%) 235% 168% 49% Fairview $127 $86 $85 $126 $154 % Growth 25% (32%) (1%) 49% 22% Intersegment Eliminations ($78) ($19) ($32) ($94) ($134) ) Total Revenue $1,560 $604 $902 $1,492 $1,788 % Growth (3%) (61%) 49% 65% 20% Adj. EBITDA Breckenridge $477 $64 $177 $345 $348 % Margin 39% 13% 27% 36% 34% Vail ($28) ($72) ($31) ($11) $0 % Margin (10%) (131%) (17%) (2%) 0 % Fairview ($10) ($43) ($46) ($40) ($14) % Margin (8%) (50%) (55%) (32%) (9%) Total Adj. EBITDA $438 ($51) $100 $295 $334 % Margin 28% (8%) 11% 20% 19% |
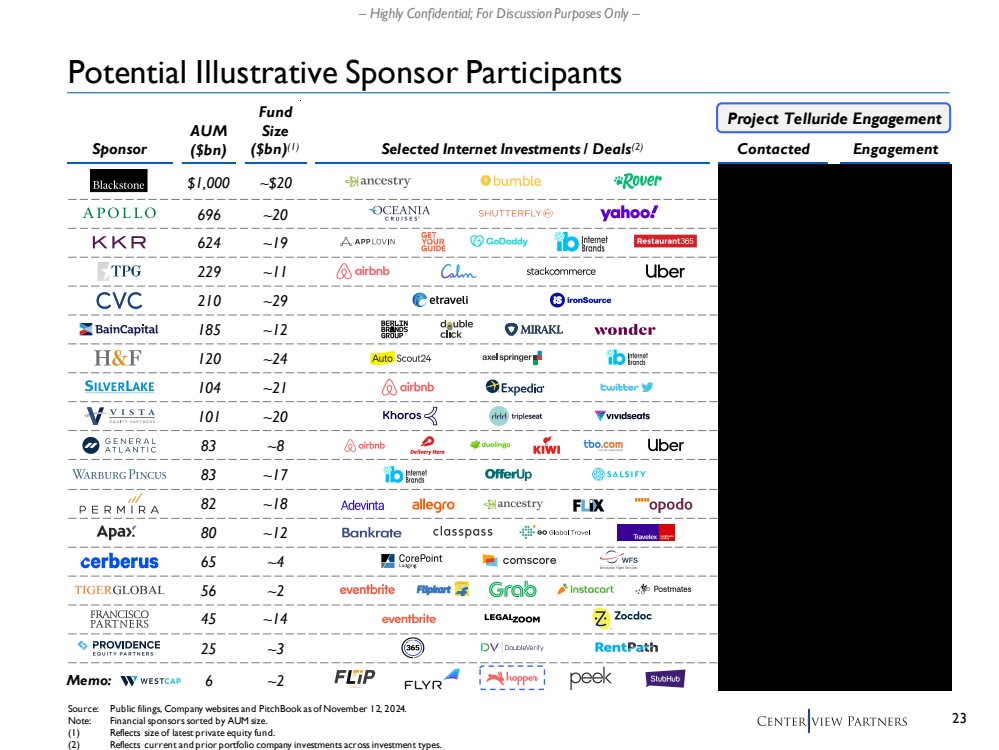
| 23 – Highly Confidential; For Discussion Purposes Only – Potential Illustrative Sponsor Participants AUM ($bn) Selected Internet Investments / Deals(2) Fund Size ($bn)(1) 696 624 229 210 185 104 101 83 83 82 65 56 45 25 6 Sponsor Source: Public filings, Company websites and PitchBook as of November 12, 2024. Note: Financial sponsors sorted by AUM size. (1) Reflects size of latest private equity fund. (2) Reflects current and prior portfolio company investments across investment types. Contacted Engagement Project Telluride Engagement Memo: $1,000 120 80 ~20 ~19 ~11 ~29 ~12 ~21 ~20 ~8 ~17 ~18 ~4 ~2 ~14 ~3 ~2 ~$20 ~24 ~12 |
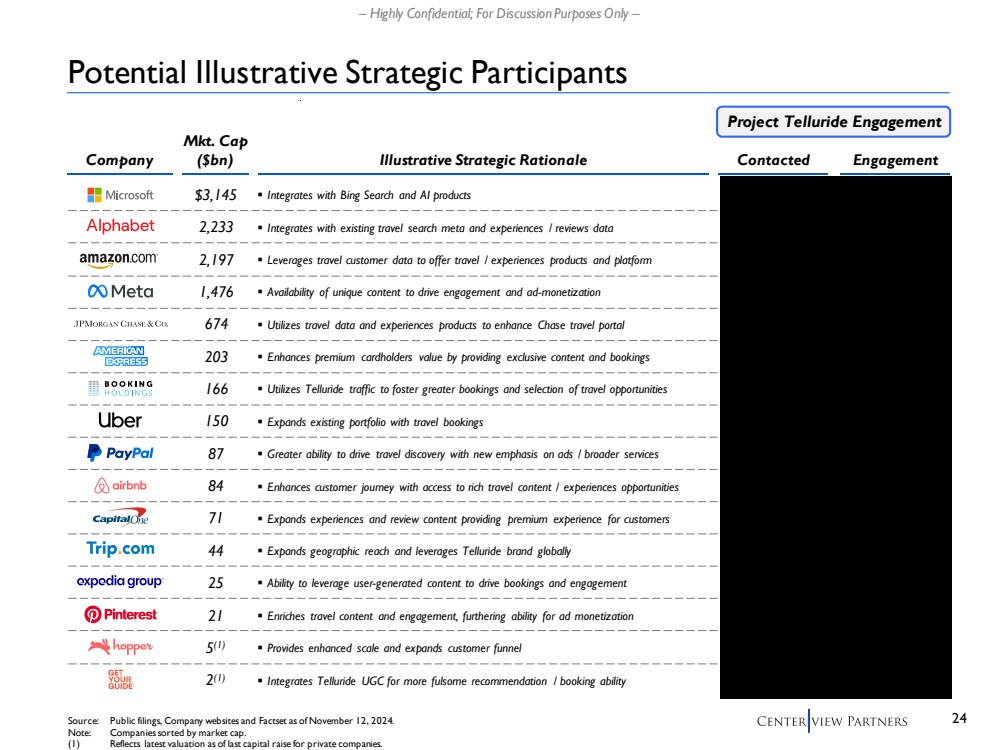
| 24 – Highly Confidential; For Discussion Purposes Only – Potential Illustrative Strategic Participants Mkt. Cap ($bn) $3,145 2,233 2,197 1,476 674 203 166 150 87 84 71 44 25 21 5 (1) 2 (1) Illustrative Strategic Rationale ▪ Integrates with Bing Search and AI products ▪ Integrates with existing travel search meta and experiences / reviews data ▪ Leverages travel customer data to offer travel / experiences products and platform ▪ Availability of unique content to drive engagement and ad-monetization ▪ Utilizes travel data and experiences products to enhance Chase travel portal ▪ Enhances premium cardholders value by providing exclusive content and bookings ▪ Utilizes Telluride traffic to foster greater bookings and selection of travel opportunities ▪ Expands existing portfolio with travel bookings ▪ Enhances customer journey with access to rich travel content / experiences opportunities ▪ Greater ability to drive travel discovery with new emphasis on ads / broader services ▪ Expands experiences and review content providing premium experience for customers ▪ Expands geographic reach and leverages Telluride brand globally ▪ Enriches travel content and engagement, furthering ability for ad monetization ▪ Ability to leverage user-generated content to drive bookings and engagement ▪ Provides enhanced scale and expands customer funnel ▪ Integrates Telluride UGC for more fulsome recommendation / booking ability Source: Public filings, Company websites and Factset as of November 12, 2024. Note: Companies sorted by market cap. (1) Reflects latest valuation as of last capital raise for private companies. Contacted Engagement Project Telluride Engagement Company |